Bin Editor
Interactive and headless editing of bin boundaries.
Architecture
WOETransformer / StabilityGrouping → bin_specs dict
                                           │
                                    BinEditor(bin_specs, X, y)   ← headless, testable
                                           │
                                 BinEditorWidget(editor)          ← UI layer only
BinEditor is a pure state machine — no display dependencies. Agents can call it directly. BinEditorWidget is a thin anywidget shell that renders in JupyterLab, VS Code notebooks, and Marimo.
BinEditor
import numpy as np
import polars as pl
from datasci_toolkit.bin_editor import BinEditor

rng = np.random.default_rng(0)
N = 1000

x_num = rng.normal(0, 1, N)
cats  = rng.choice(["A", "B", "C", "D"], N)
y = ((x_num > 0) | np.isin(cats, ["A", "B"])).astype(float) * rng.binomial(1, 0.8, N)
months = np.repeat(np.arange(5), N // 5)

X = pl.DataFrame({"num": x_num.tolist(), "cat": cats.tolist()})
y_s = pl.Series(y.tolist())
t_s = pl.Series(months.tolist())

bin_specs = {
    "num": {"dtype": "float",    "bins": [float("-inf"), -1.0, 0.0, 1.0, float("inf")]},
    "cat": {"dtype": "category", "bins": {"A": 0, "B": 0, "C": 1, "D": 2}},
}

editor = BinEditor(bin_specs, X, y_s, t=t_s, stability_threshold=0.1)
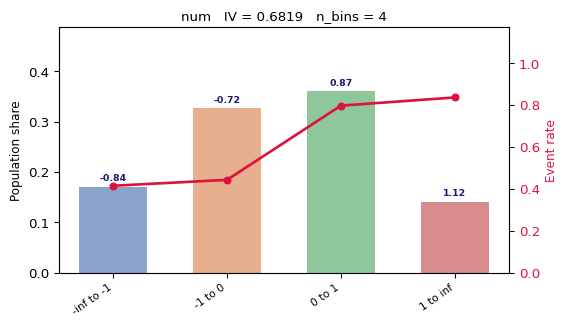
Inspecting state
state = editor.state("num")

print("n_bins:", state["n_bins"])
print("IV:    ", round(state["iv"], 4))
print("RSI:   ", round(state["temporal"]["rsi"], 4))

for i in range(state["n_bins"]):
    print(f"  bin {i}: woe={state['woe'][i]:.3f}  n={state['counts'][i]:.0f}")
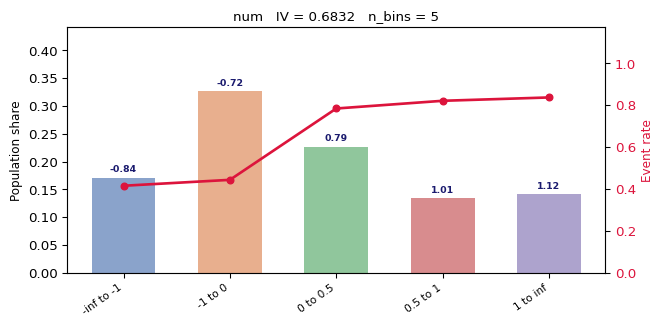
Splitting
# Add a boundary at 0.5
s = editor.split("num", 0.5)
print("After split — n_bins:", s["n_bins"], "IV:", round(s["iv"], 4))
Merging
# Merge bin 1 with bin 2 (remove the boundary between them)
m = editor.merge("num", bin_idx=1)
print("After merge — n_bins:", m["n_bins"])
Undo / Reset
editor.undo("num")   # revert last operation for this feature
editor.reset("num")  # revert to original bin_specs
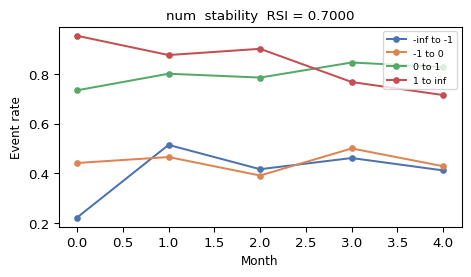
Stability chart
Event rate per bin across time periods. Requires time_periods to be passed to BinEditor.
Suggested splits
Ranked by IV gain — useful as a starting point.
suggestions = editor.suggest_splits("num", n=5)
print(suggestions)

# Apply the best suggestion
editor.split("num", suggestions[0])
Accepting
Export the current state of all features as a new bin_specs dict ready for WOETransformer.
final_specs = editor.accept()
# Now pass to WOETransformer
from datasci_toolkit import WOETransformer
woe = WOETransformer(bin_specs=final_specs).fit(X, y_s)
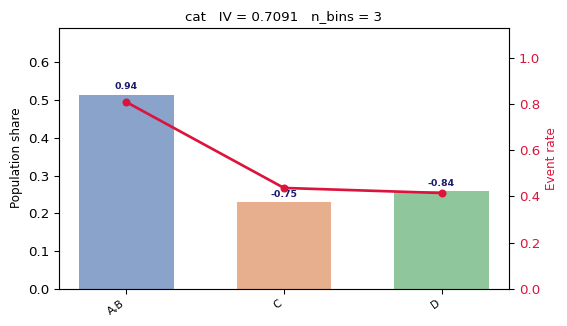
Categorical features
Categorical bins group labels into integer buckets. The chart shows the same WOE bar + event rate overlay.
BinEditorWidget
Interactive UI for JupyterLab, VS Code notebooks, and Marimo. All state lives in BinEditor — the widget is a rendering shell only.
from datasci_toolkit import BinEditorWidget

widget = BinEditorWidget(editor)
widget.show()  # renders the interactive chart + toolbar

# After editing in the UI:
final_specs = widget.result_
The widget provides:
- Feature dropdown to switch between variables
- WOE bar chart with event rates
- Stability chart (RSI per bin over time, if
twas provided) - Split / merge / undo / reset / suggest toolbar buttons
- IV and RSI summary displayed live